 |
|
Here we show 2 figures (Figure 3 and Figure 4) present in our publication
accepted by the NAR special issue on WEB based software (July-2003), as
well as the complete description about how to obtain those images. Special attention
on those figures are give to one amino acid from PDB file 1cho.pdb:
His 57, belonging to the E chain. We have prepared collage of
images produced by STING Millennium, Ramachandran
plot, Graphical Contacts, ConSSeq
and Protein Dossier. This is the most comprehensive
data set that you can get in warp speed. Courtesy of STING Millennium Suite
ONLY.
Enjoy the cruise!
Note: All images are taken (copied) directly (Alt Prt Scr) form
the SMS generated output. We have done little or non "make-up"of the
images. Only specific residue (His_57) boxing and arrows are result of such
"make-up". Complete figure is a collage, result of resizing and putting
together separate images for best arrangement within the publication.
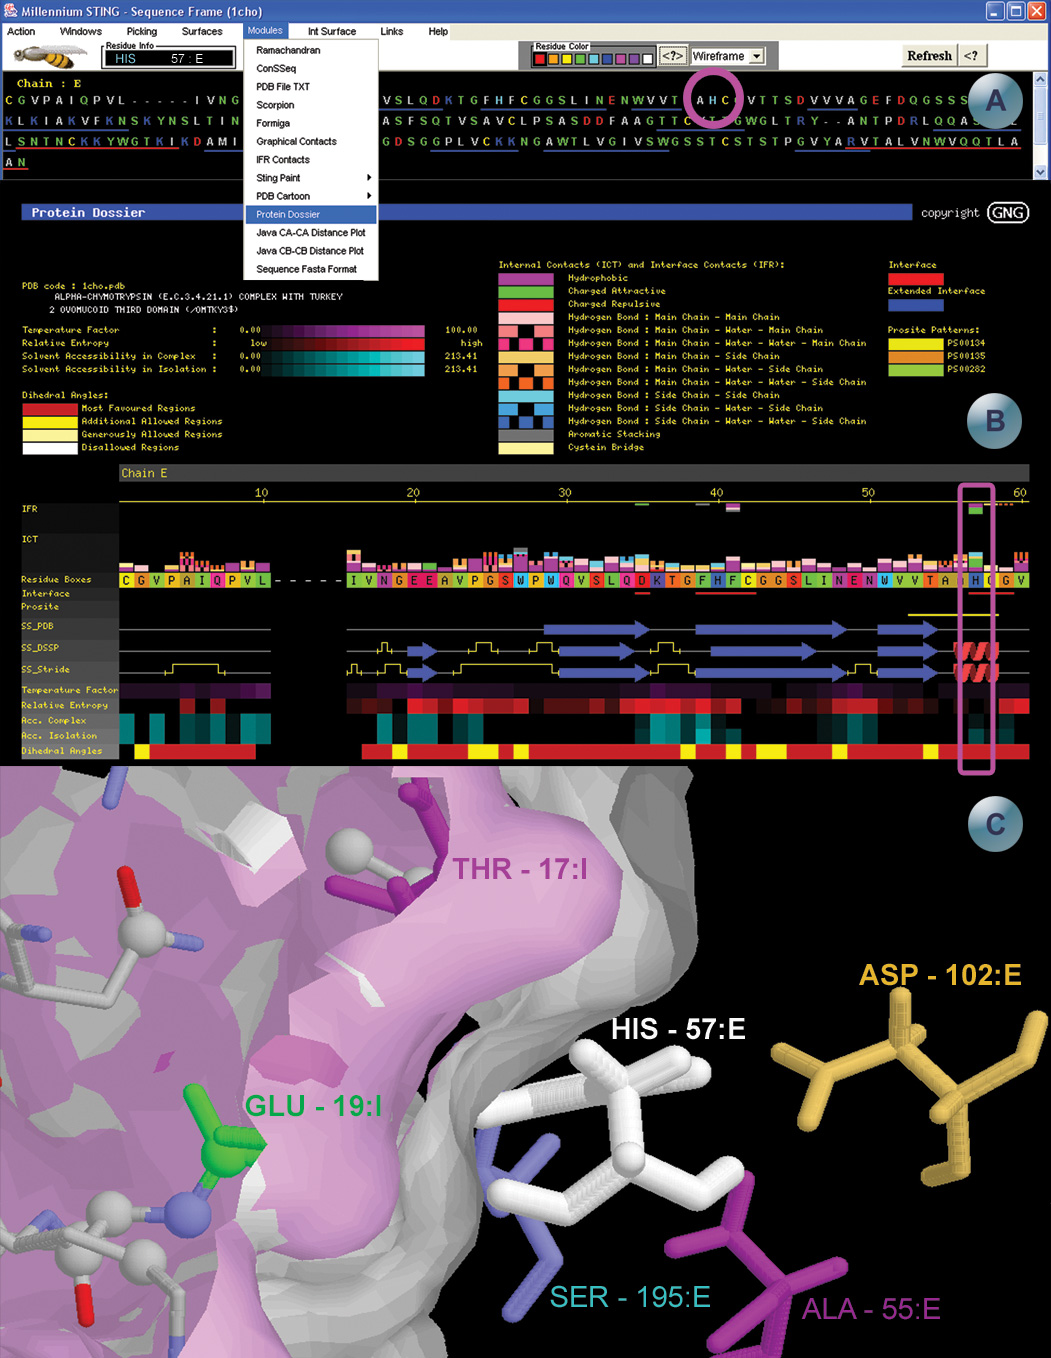
Figure 3 in NAR 2003 SMS publication
In this example, we have first initiated STING Millennium and then asked number of question about specific amino acid: the HIS#57 in the E chain;
A)_At Figure
3 above, we present at Inset A,
STING Millennium Sequence Window. His_57 is circled by magenta line.
B)_At inset B,
we asked to see all pertinent parameters
that can be calculated and shown for this protein specific sequence and
3D spot (His_57 is boxed).
(SMS module used: Protein Dossier)
C)_At the inset C
we show 3D constellation of the His_57 and surrounding amino acids. Depicted
amino acids are those which have created different types of contacts with the
His_57. Color coding of those residues is done according to the type of the
contact established with His_57. Surfaces are generated using SMS surface feature....
Exact sequence of action to obtain presented image is as follows:
1. Select the item "Interface Chain..." in the Menu "Windows"
and then define the interface (1st Half -> Chain E, and 2nd Half -> Chain
I).
2. Select the item "Distance->1st Half" no menu "Int
Surface".
3. Select the item "Distance->2nd Half" no menu "Int
Surface".
4. Select the item "Send script..." in the Menu "Windows"
to open the dialog to send Rasmol scripts to Chime. Enter with this command
: "select all; restrict *I;"
5. Open Graphical Contacts (Menu "Modules") selecting Chain
E.
Scroll the sequence until it be centered on residue HIS 57.
Click with Left Mouse Button over the residue letter.
6. Open IFR Contacts (Menu "Modules") selecting chain E.
Scroll the sequence until it be centered on residue HIS 57.
Click with Left Mouse Button over the residue letter.
At the Figure 4 bellow, we present a collage of SMS generated results for the same protein structure described in PDB file 1cho.pdb:
A)_At the Inset A,
we present a Cb-Cb distance geometry using SMS component: Java Cb-Cb distance
.
B)_At inset B,
Figure 4, we show image produced by SMS
component: ConSSeq. Again, His_57 is boxed.We asked here to see how much this
spot was exposed to the evolutionary pressures
and what other residues also occupy this spot. (SMS module used: ConSSeq)
D)_At the inset D,
Figure 4 bellow, we asked what type of internal
chain contacts this residue makes? And how many? (SMS module used: Graphical
Contacts).
E)_At the inset E,
Figure 4 bellow, we asked what type of across-the-interface-contacts
(IFR Contacts) this residue makes? How many? (SMS module used: IFR Graphical
Contacts). It is from this point that we were able to see 3D
constellation of residues in IFR contact with our His 57 (see inset C
of Figure 3 above); Clicking with the left
mouse button over His_57 in IFR Graphical Contacts window, will generate image
showing all residues in contact across the interface.
C)_At the inset C,
Figure 4 bellow, we show HTML table listing
all of the identified IFR contacts for the whole E cahin. Highlighted within
red BOX are contacts belonging to His_57. This HTML table might be obtained
by clicking "Contacts Output" button on the GC_Legend window, shown
simultaneously on the user screen together with GC and IFR GC window (both depicted
here on inset D and E).
F)_We were also curios to know about dihedral
angles and therefore, regularity of the structure at that specific spot.
(SMS module used: Ramachandran Plot) At the
inset F, Figure
4 bellow, SMS_ramachandran Java plot is shown. Green
arrow is depicting position of the His_57.
G)_At the inset G,
Figure 4 bellow, we show output generated
by SMS module FORMIGA. Here the user can find information on local 3D environment
surrounding His residues within given protein structure. Parameters chosen are:
Sphere radius: 7 A, Base residue: His, Center of the sphere: Last Heavy Atom
in the His Side chain, Secondary structure containing neighboring residues:
no preference, Degeneracy of the DNA triplet code: no preference. Cys and Ser
residues are identified as most commonly found within given restrictions.
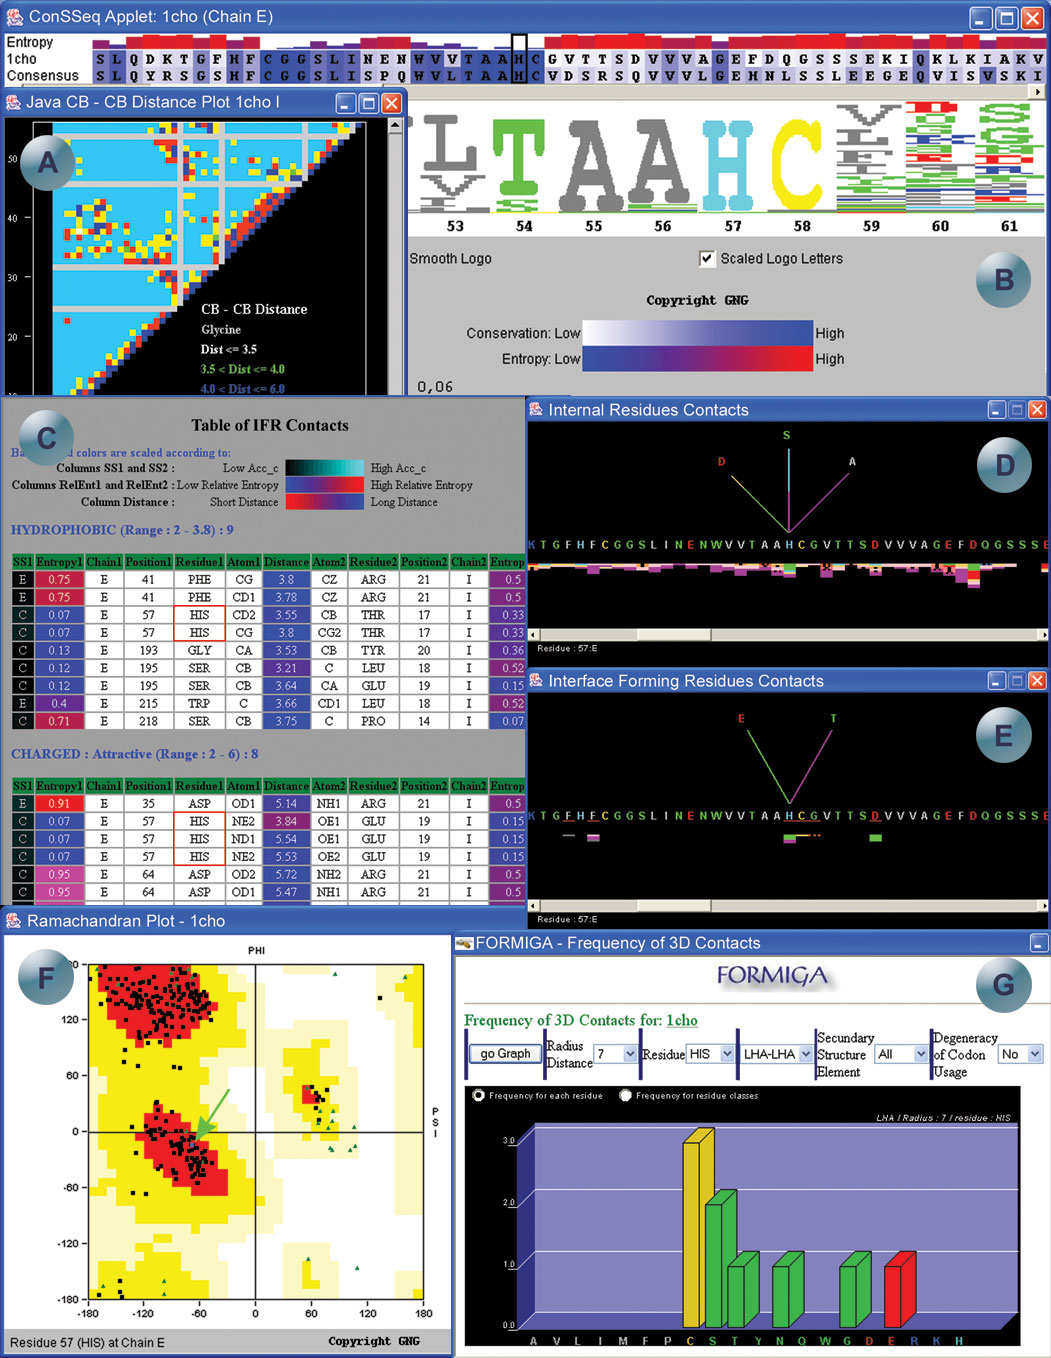
Figure 4 in NAR 2003 SMS publication
We used only a few of SMS components in this short example, however, a number of other parameters can be calculated and shown (see for additional information below!). Also, see about extensive list of Links available through SMS that can significantly enrich volume of information you are looking for about given structure.
|
Go to Quick Learn: Modules
|
Go to Quick Learn: Modes
|