3D Java MP Plot Help
Selecting data to be plotted
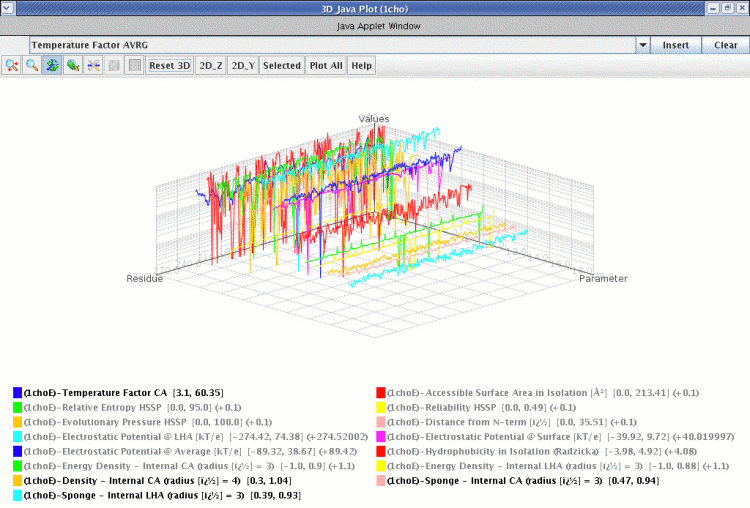
3D Java MP Plot is the STING component which permits to a user examine simultaneous parameters (150 different) in a simple yet intuitive 3D plot showing the numerical values at theZ-axes, the sequence residue numbers at the X-axis and parameters at the Y-axis.
In order to obtain such plot, a user nedds to choose one PDB code and press the STING It button. Then, a plot as above will be presented.

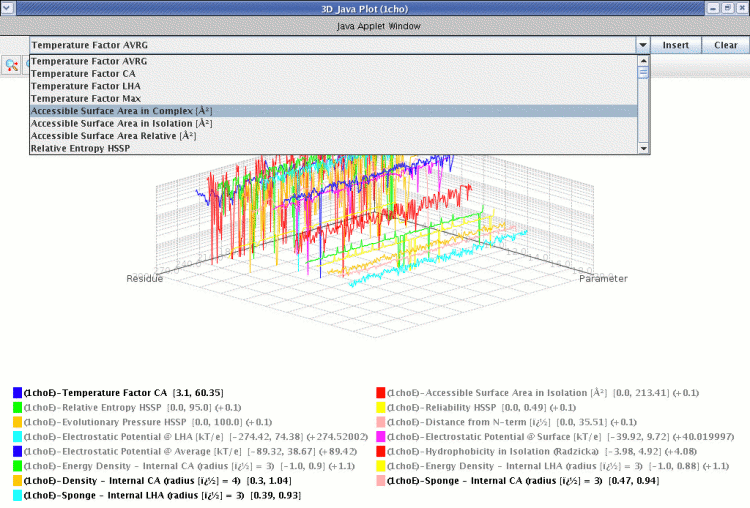
Then, you can select aditional parameters that you intend to plot in the graphic, using the combo at top of the window, press the button "Insert". Repeat this procedure for all the parameters you want to insert in the graphic.
Changing the 3D perspective
You can rotate the 3D perspective clicking and dropping around the graph. To restore original 3D perspective view click "Reset 3D" button localized in window toolbar.
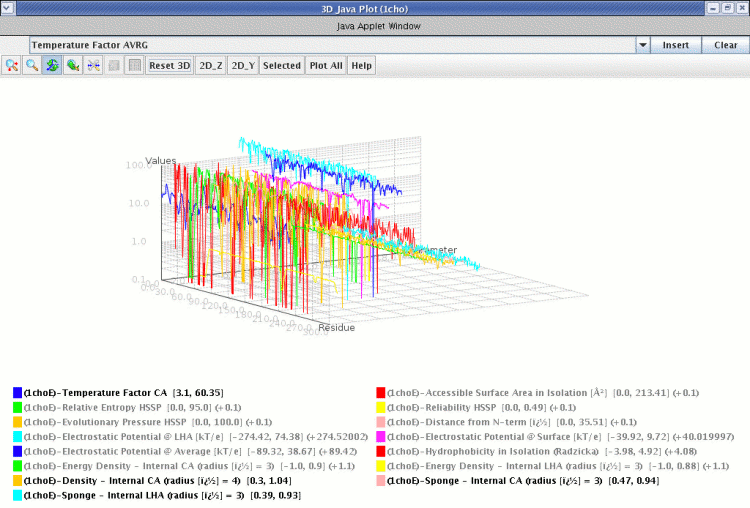
Selecting 2D_Z View
2D_Z view button aligns the 3D graph in axes X-Z permiting quickly visualization of parameters scale variations.
Click "3D Reset" button to restore 3D perspective view.
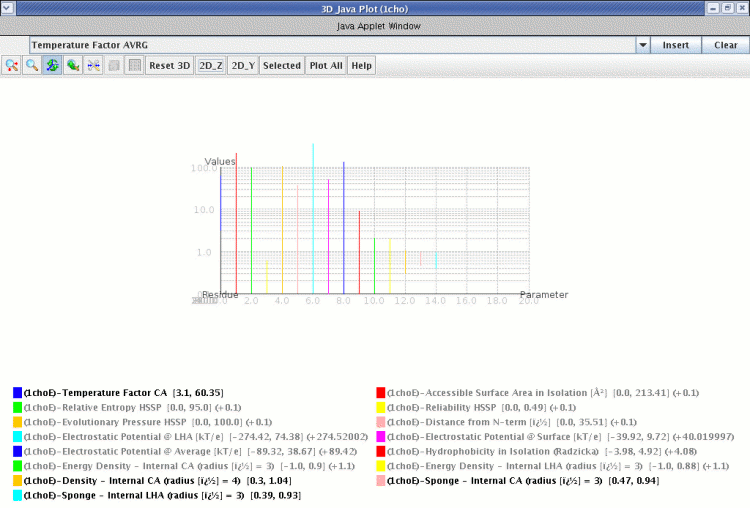
Selecting 2D_Y View
2D_Y view button aligns the 3D graph in axes Y-Z permiting quickly visualization of parameters variations across residue numbers.
Click "3D Reset" button to restore 3D perspective view.
Cleaning 3D visualization
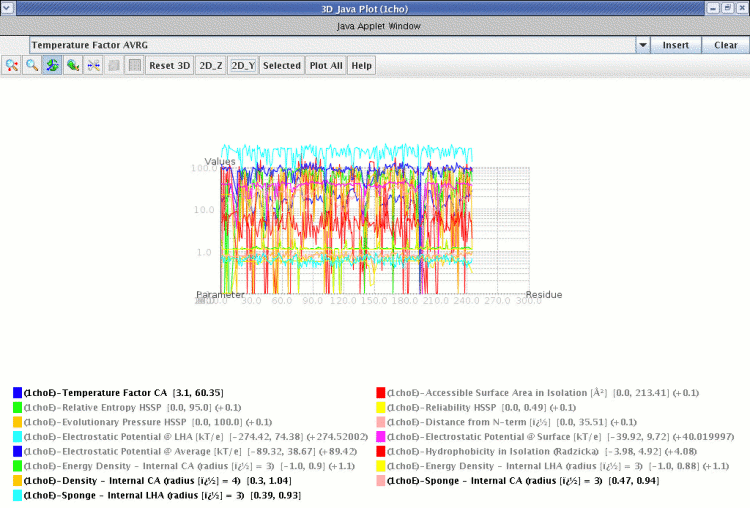
Once you have selected a set of simultaneous parameters, you can see the graph sometimes too dense. You can clean the visualization selection few parameters by single click in parameter legends and when all desired parameters has been selected click "Selects" button of toolbar.
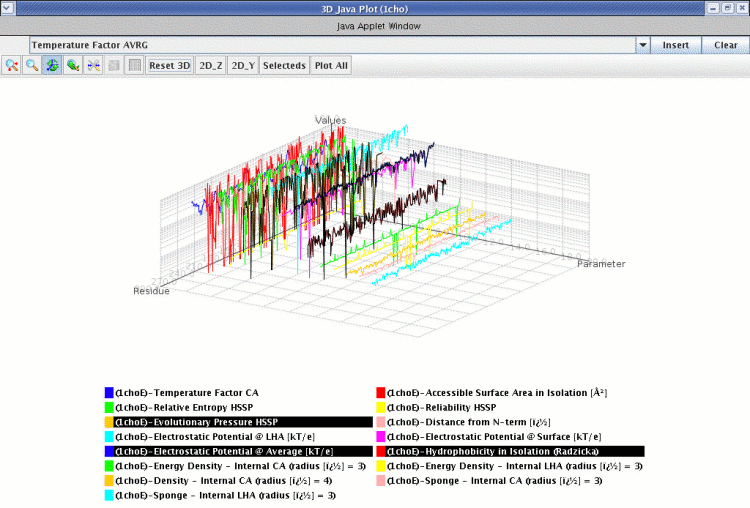
After selection:
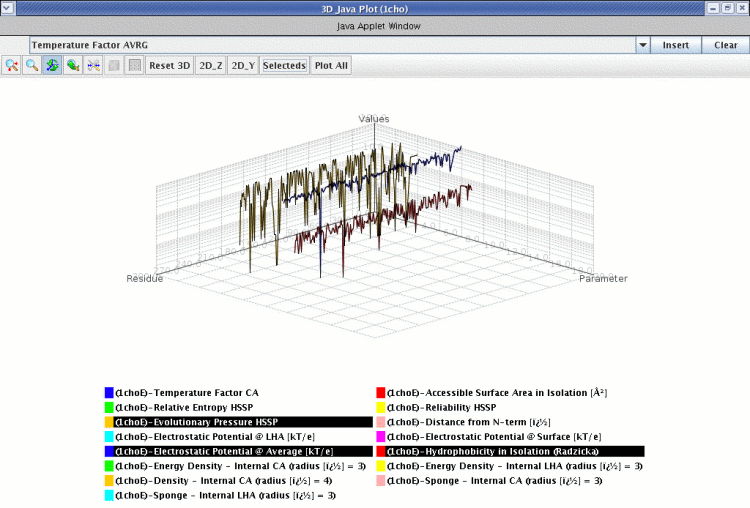
Click somewhere near graph to unselect parameters and restore their original plot colors:
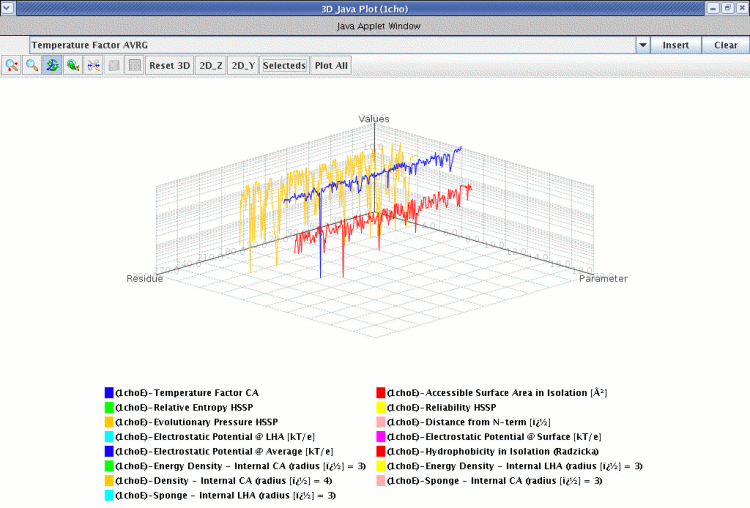
You can restore all parameters plots clicking "Plot All" button.
If desired you can too clean definitively all parameters in graph clicking "Clear" button (top-right window position). After "Clear" you could add parameters with the "parameter combo" at window left top.
Changing Graphic Scale to Highlight parameters variance
Some parameters with minimum Z scale variation, like "Sponge - Internal CA", when showed together other parameters like "Acessible surface area in isolation", that have large scale variation, can turn difficult to see its variation graphically.
To produce better results you can select parameters with similar scale variation and change the scale min-max. You need fist to select and plot these similar, in scale values, parameters, as showed above
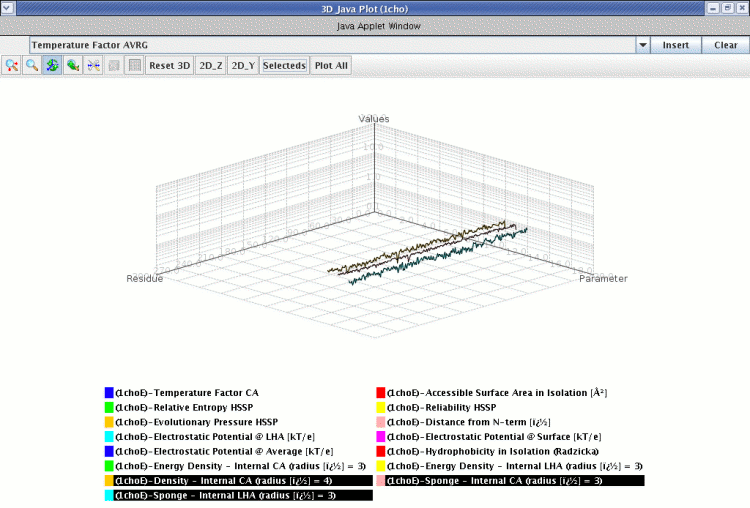
After selected the similar, in scale variance, parameters, now you can change scale clicking the "Set scales" button localized at graph toolbar. 
A window for scale updates is opened like above:
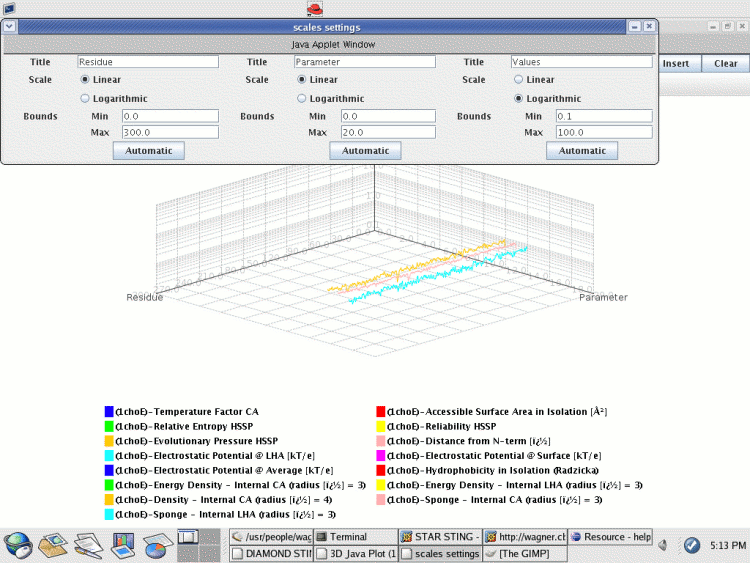
In this example, I change the "Values" scale from logarithmic to linear and Min from 0.1 to 0 and Max from 100.0 to 1.0, look the result, much better now to see the parameter variations across residues:

Zooming image
You can zoom the image clicking zoom button  , and with the mouse after clicked zoom button drag a rectangle area to be zoomed:
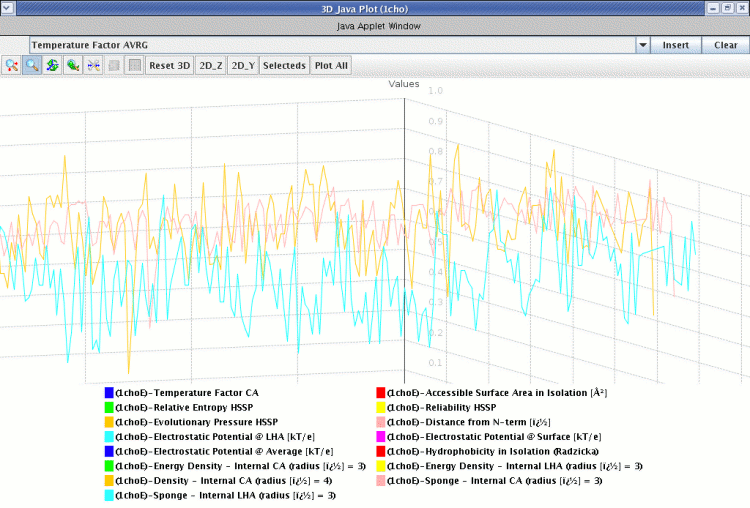
After the zoom was done, remind to click the "Rotate axes" button  otherwise at each mouse click the image will continue to be zoomed.
To reset zoom view click the "Reset Zoom" button - 