BLUE STAR STING X_Y Java plots
This is a short picture description on how the BLUE STAR STING X-Y Java Plots function.
A user is asked to click on the area of the figure below which will take him/her to the help subject of the interest. Also, a user is asked to click on the title of the Java Plot window in order to enlarge a figure. Test this features and we hope learning process will take no more than 60 seconds.
Graphics panel:
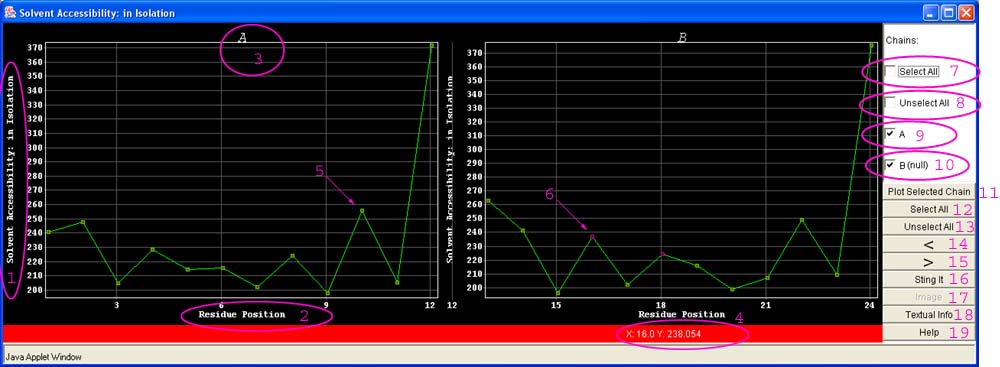
3 - Name of the selected chain
4 - Status Bar - displays the X and Y coordinates for the point in the plot above which mouse is placed.
6 - Selected Point: to select point it is necessary to click above it with a left mouse button.
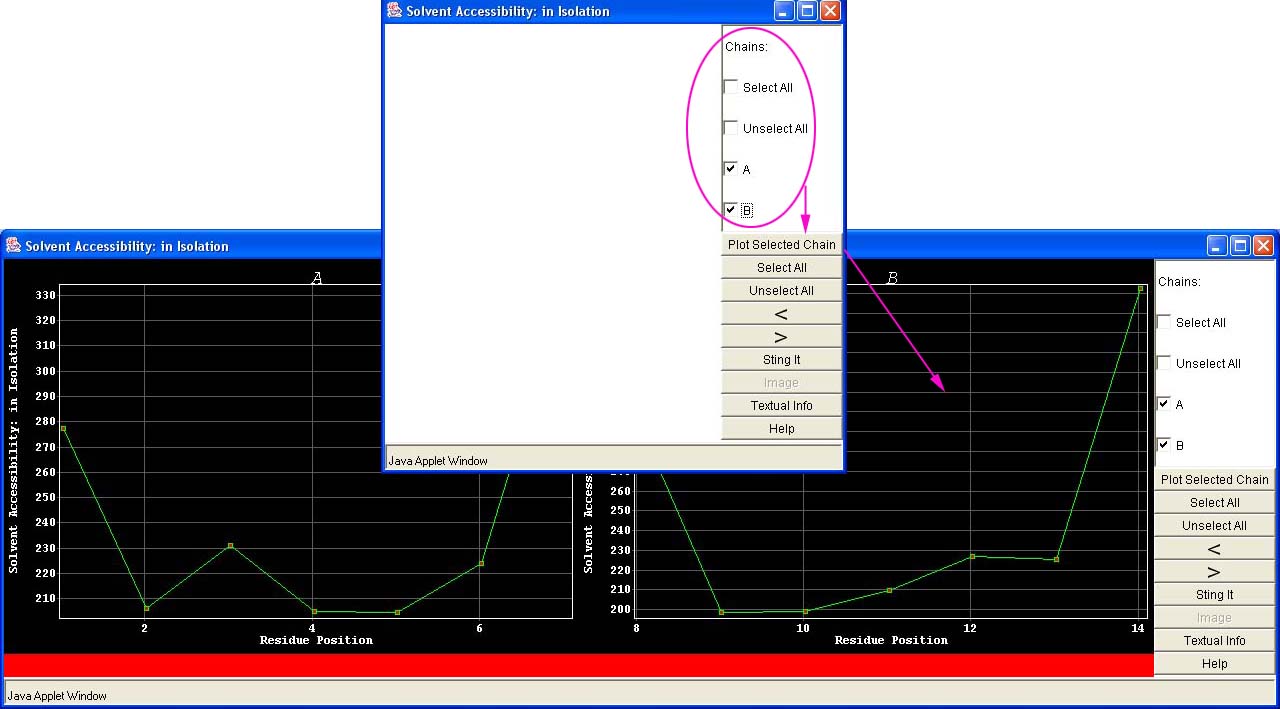
7 -Select All - if marked, will select all chains to be plotted in the Java X-Y plot
8 - Unselect all - if marked will clear up selected chains (no chain will be selected for the X-Y plot).
9 - Chain A is selected only (in this case)
10 - Chain B (null) there are no data available in BLUE STAR STING Data Base to be show by X-Y plot.
11 - Plot Selected Chain: Causes Java X-Y plot to plot all data for selected chains(s) (in this case chain A and chain B are selected and two plot areas will be shown).
12 - Select All: Will select all points in all possible plots (including those which are not currently displayed because they were not selected previously in "Chin select area"
13 - Unselect All: Will select all points in all possible plots (including those which are not currently displayed because they were not selected previously in "Chin select area".
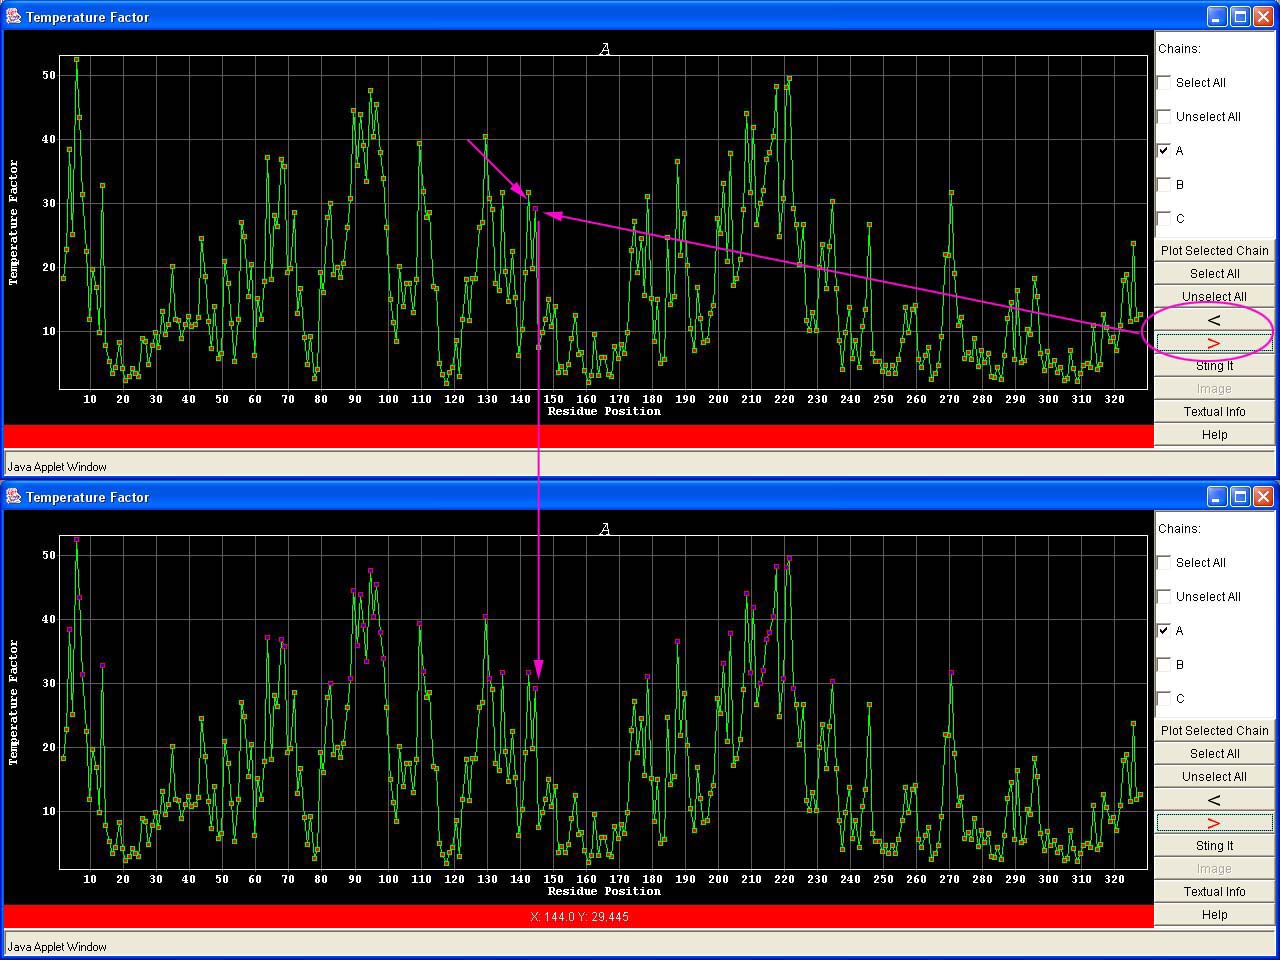
14 - < (Less than sign): When marked, the "less than"sign turns red. In this activated state, it turns on the function "less than" which will select all the points with the Y-axis value lower than the one of the point which was clicked on. See the picture talk below.(To turn off this function, click at the sign "less than"again!)
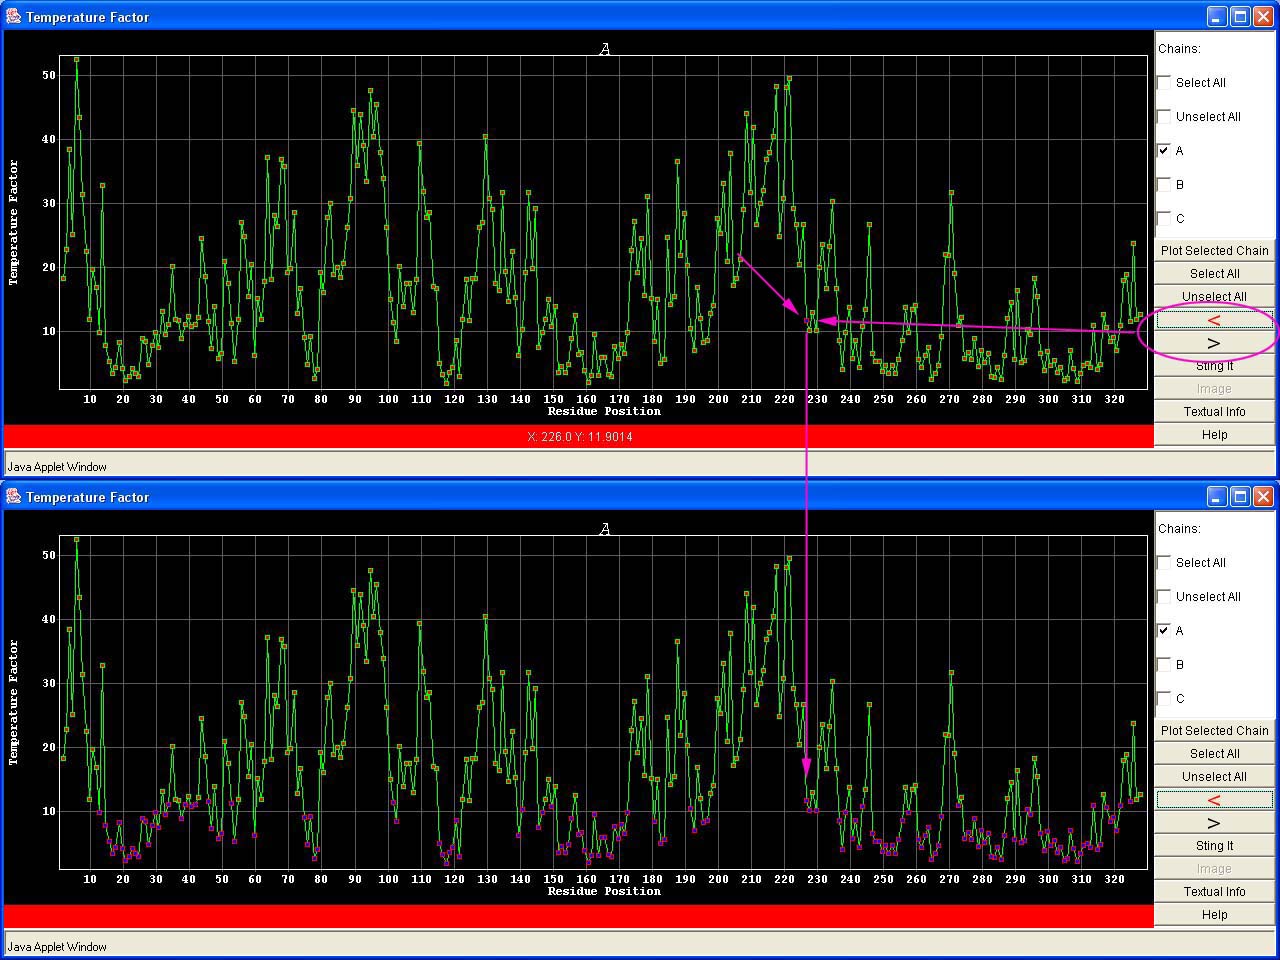
5 - >(Larger than sign): When marked, the "larger than" sign turns red. In this activated state, it turns on the function "larger than" which will select all the points with the Y-axis value higher than the one of the point which was clicked on. See the picture talk below.(To turn off this function, click at the sign "larger than"again!)
Note #1- If both "Less than" and "Larger than" signs are activated (both are displayed in red color), a new function is turned on: select all points (residue parameters) with the Y-axis value being within selected min-max values. See the picture talk below.
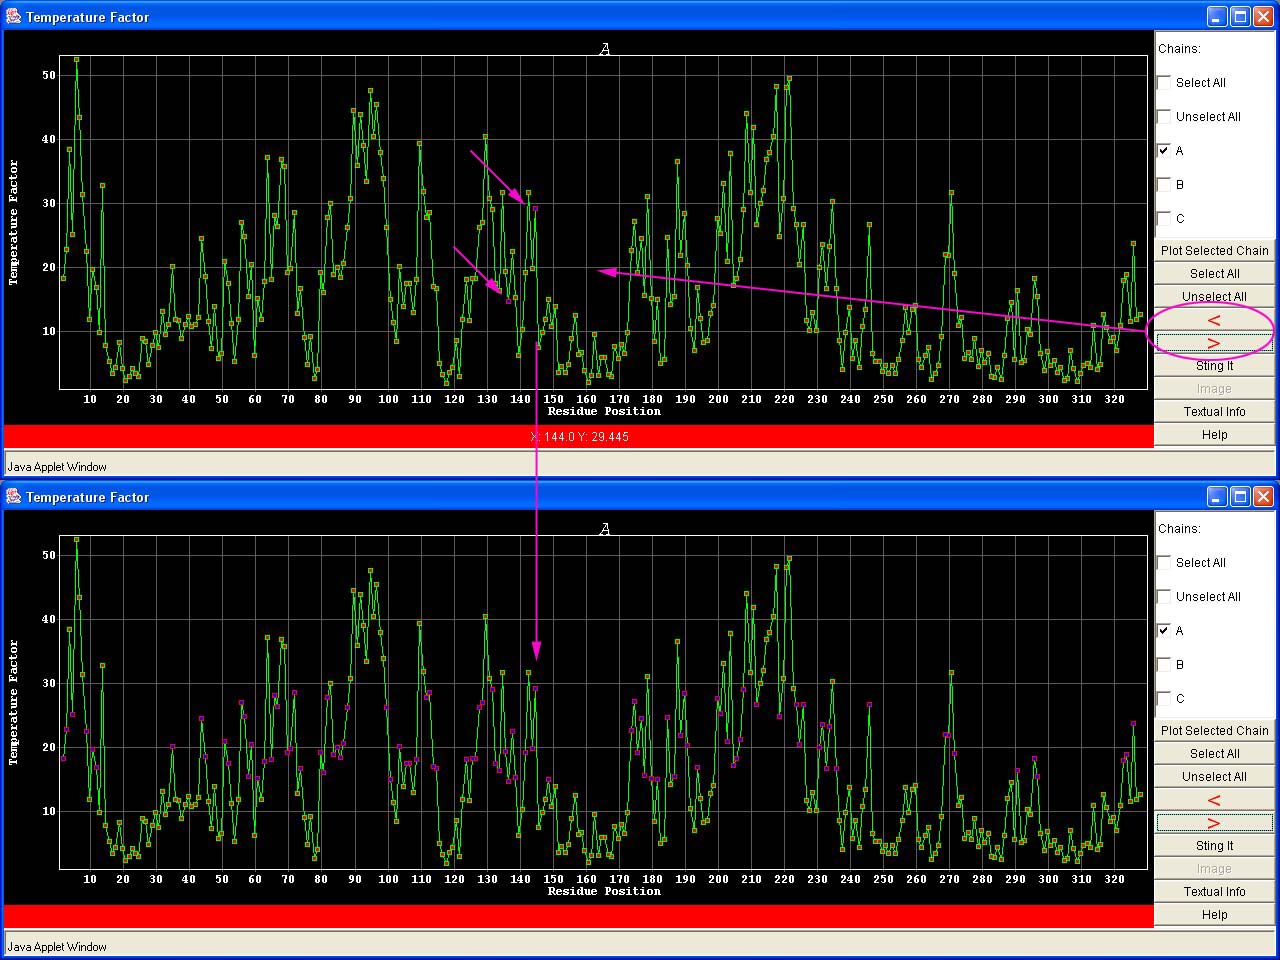
Note #2 - remember to deactivate those two function buttons if non of the above actions are to be performed.
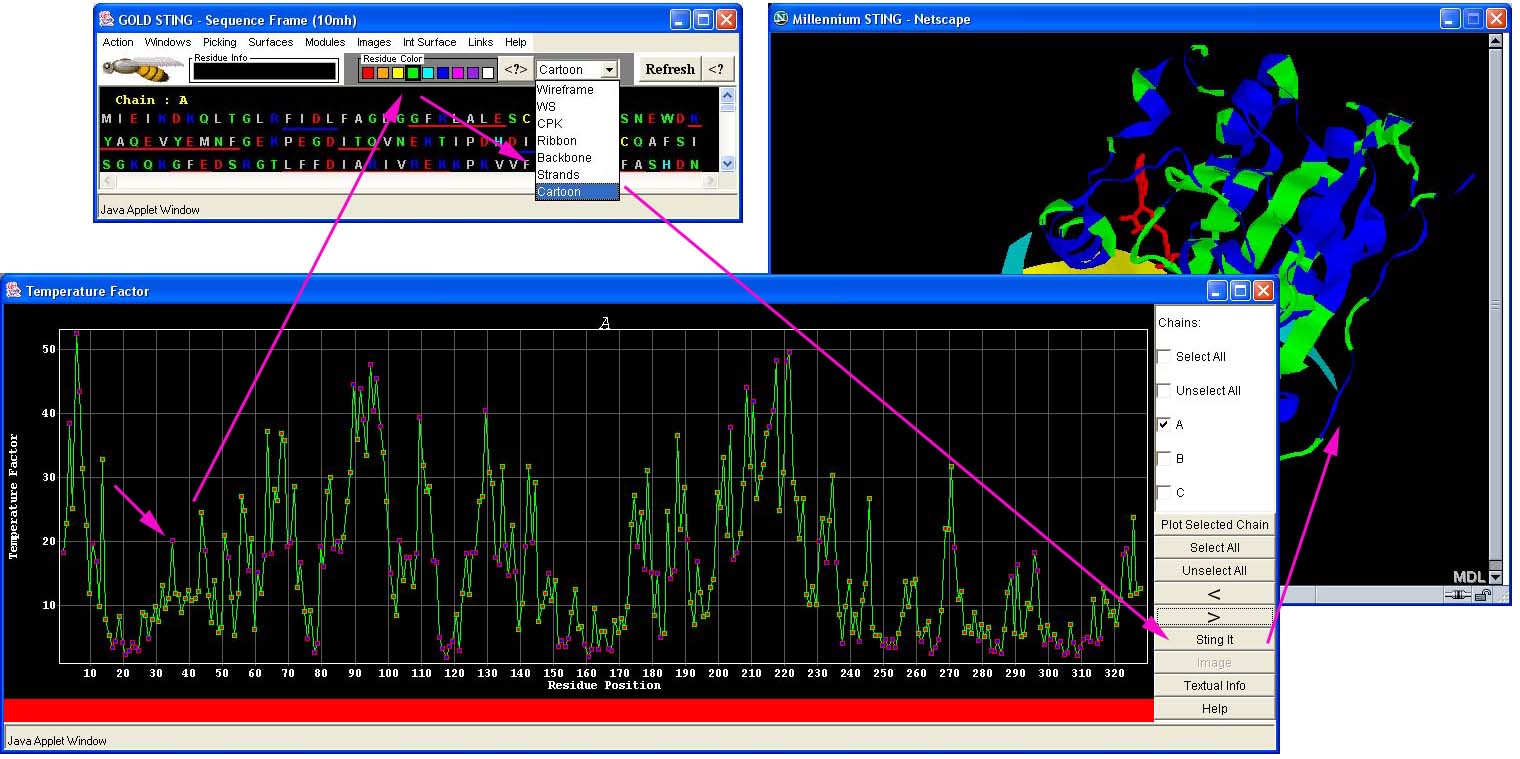
16 - Sting It: this button will paint in chosen rendering format (in this case green color cartoon) all selected points (residue parameters) in Chime window. See the picture talk below.
17 - Image: this button will generate a GIF image of the selected chain and points, so that a user may print it and use it in publication.
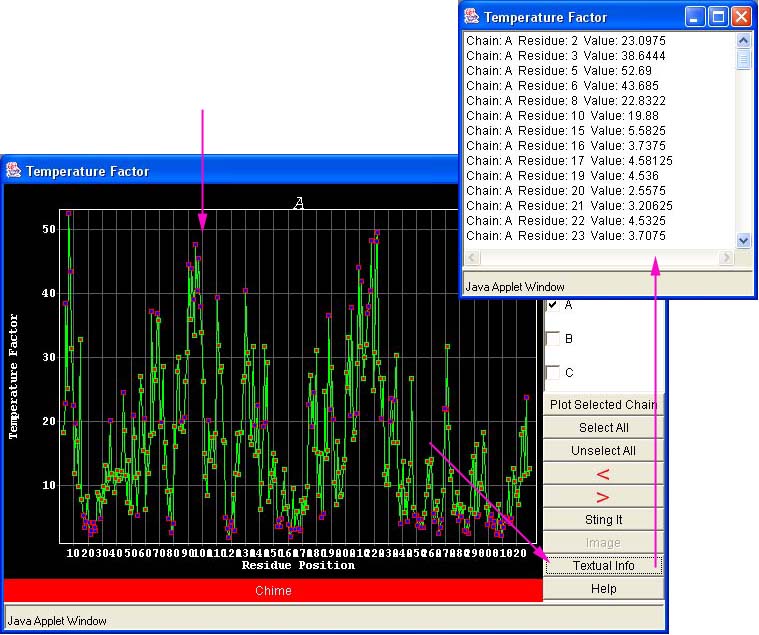
18 - Textual Info: This option will show a textual information of the values (x,y) for all the selected points (even those which are not currently shown in the X-Y Java Panel):