XY Graphics Java Plot Help
Selecting data to be plotted
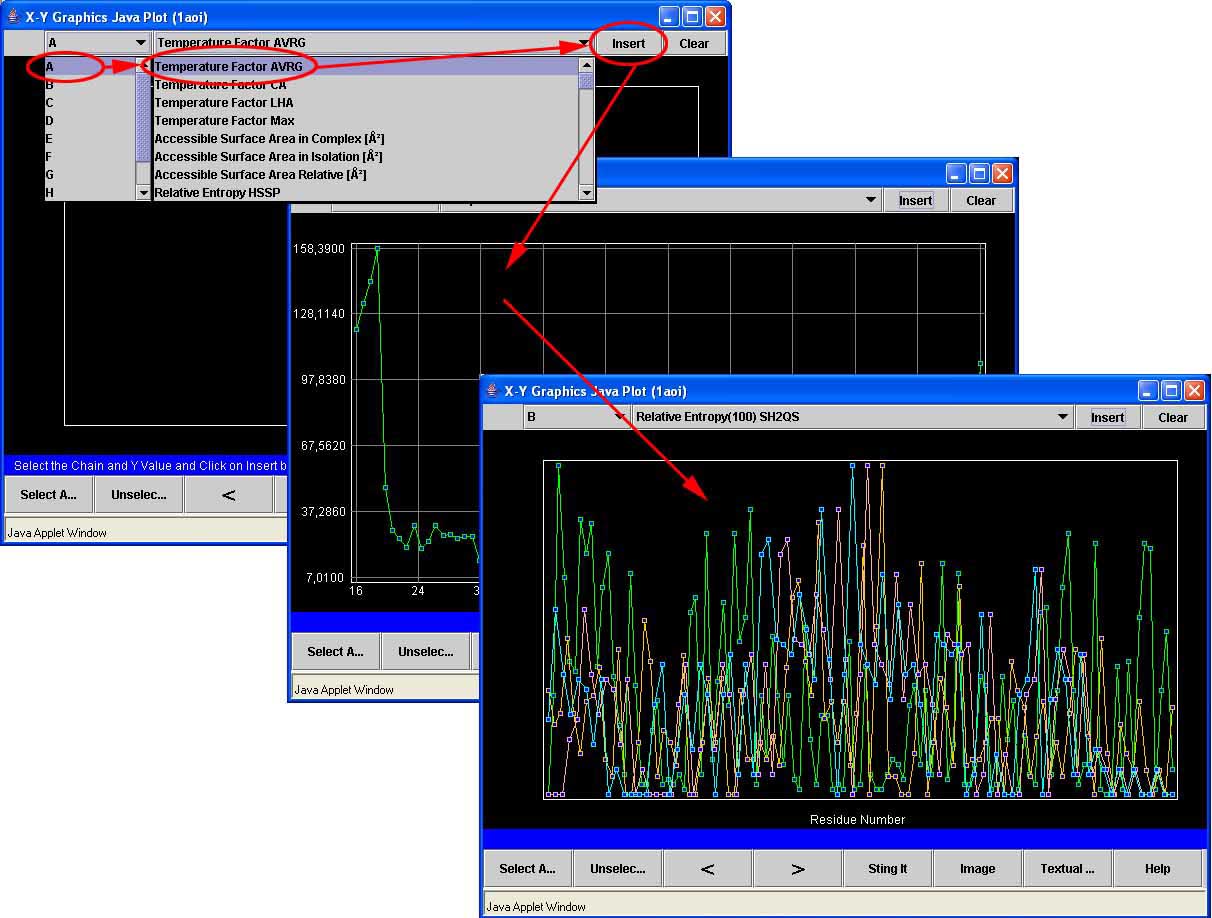
XY Graphics Java Plot is the STING component which permits to a user to examine one of 150 different parameters in a simple yet intuitive plot showing the numerical values in theY-axes and the sequence residue numbers in the X-axis.
In order to obtain such plot, a user needs to choose a chain from the leftmost column of the menu of the window "X-Y-Graphics Java Plot". Then, select a parameter from that chain that you intend to plot in the graphic, using the second column of the same menu. Finally, press the button "Insert". Repeat this procedure for all the parameters you want to insert in the graphic.
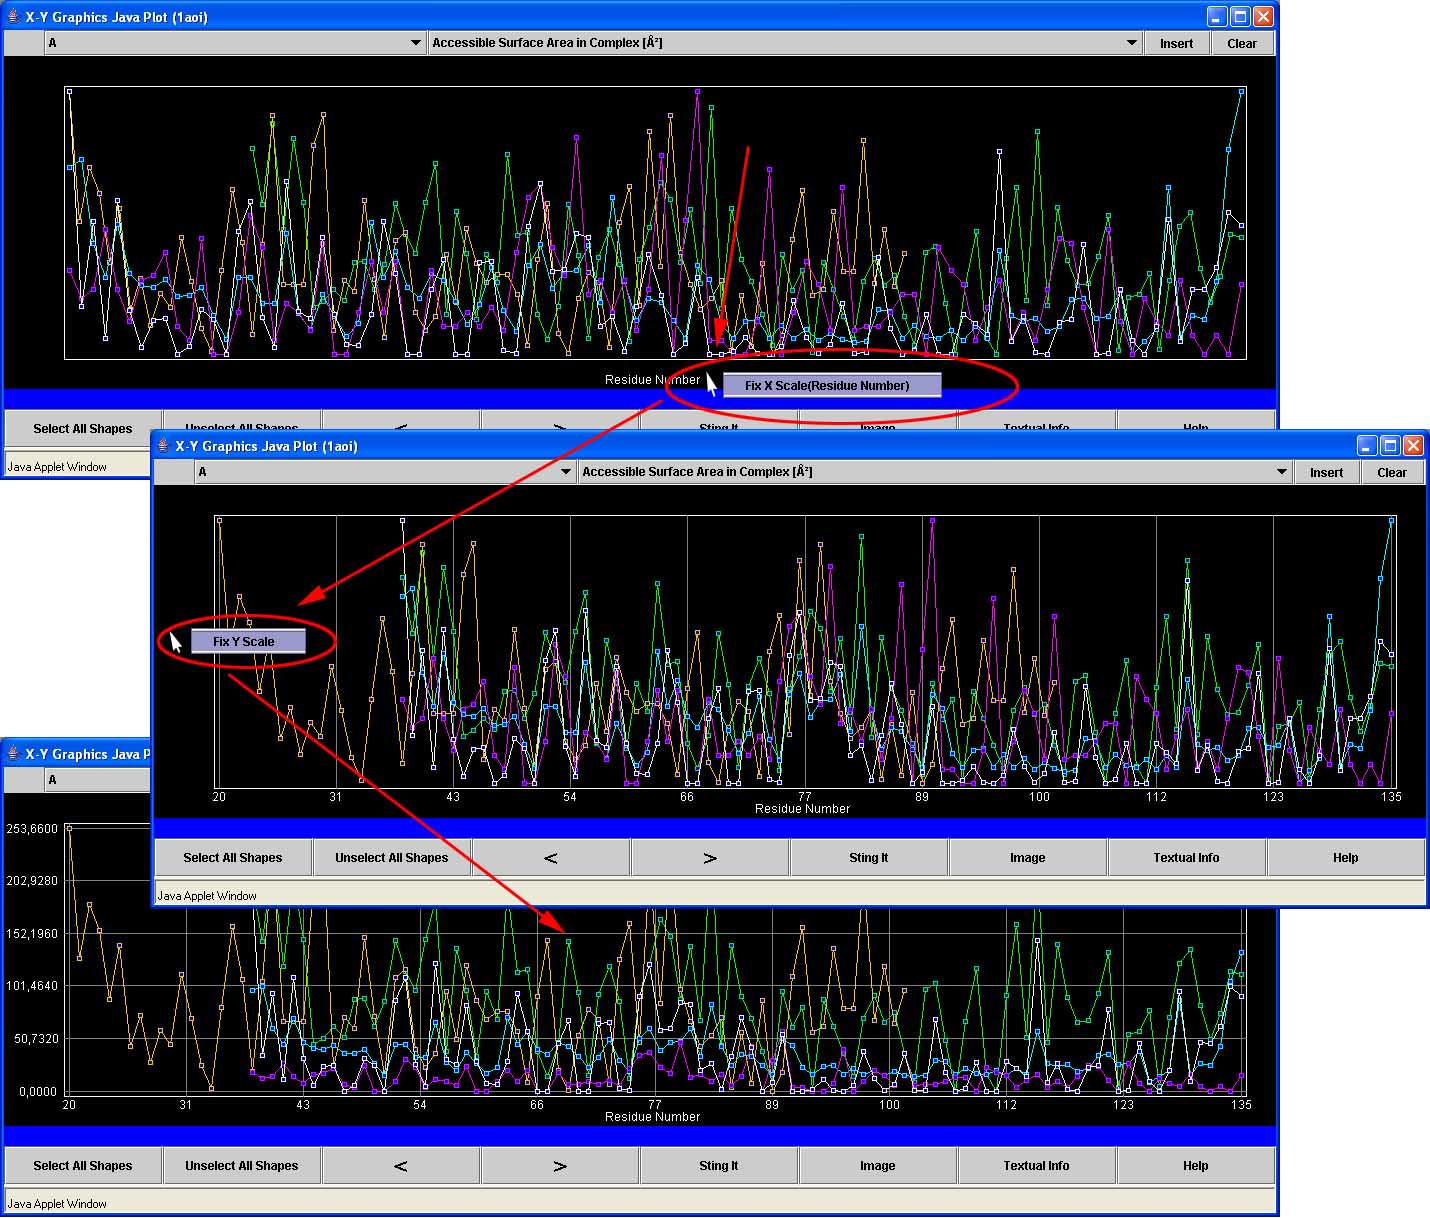
Selecting the same scale for the parameters
When you select more than one parameter to be plotted in the graphic, the scale frames for the different parameters can disappear. In order to see the scale frame for a particular parameter, move the pointer (mouse cursor) to the small square representing any particular residue in the colored line tracking the values of that parameter for the several residues. You can also fix the scale frame of the largest scale by moving the pointer to the legend of the X-axis, pressing the right button of your mouse, and choosing Fix X-scale. In order to unfix the scale, move the mouse to the legend, press the right button of your mouse and choose Unfix X-scale. The procedure to fix and unfix the Y-scale is analogous.
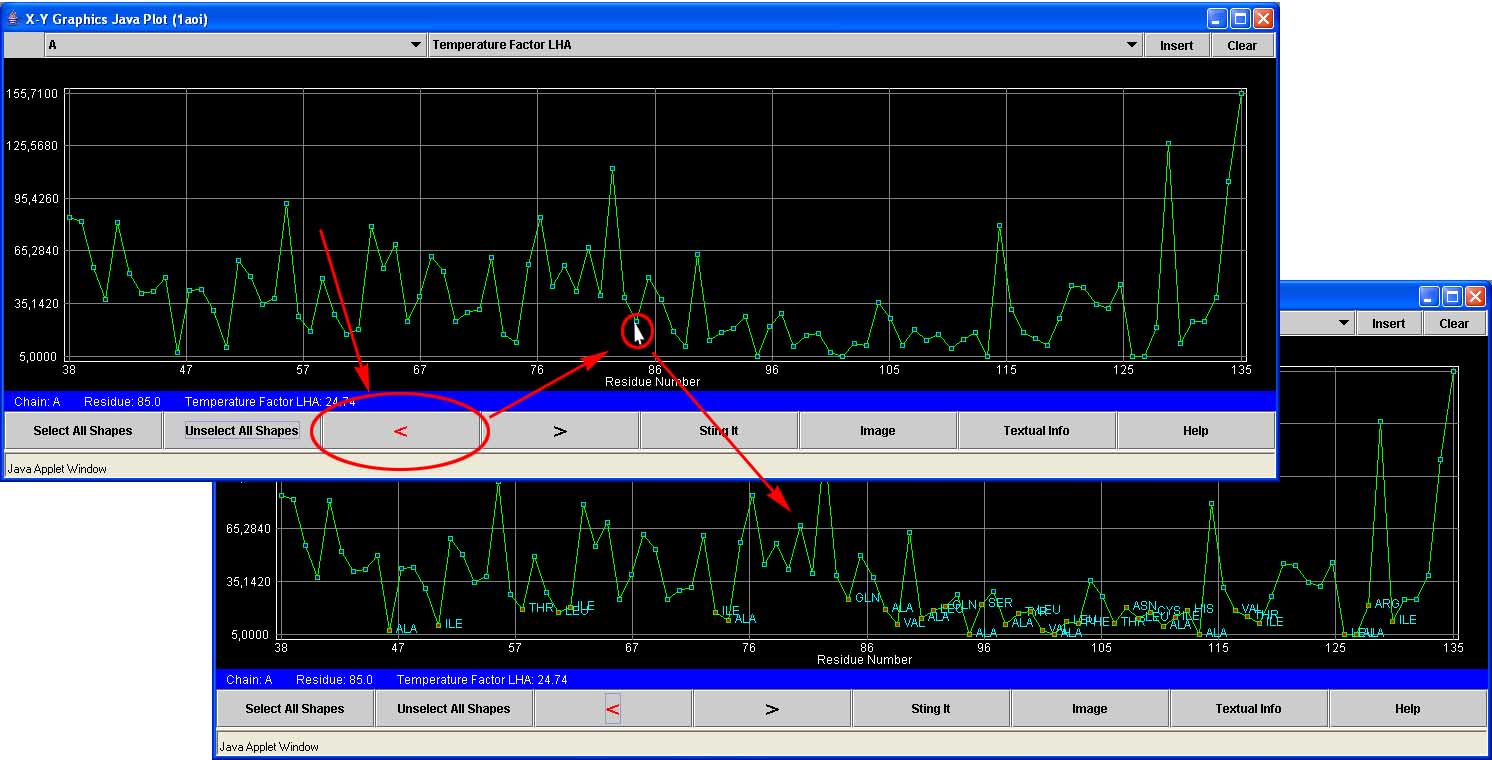
Selecting residues
You can select particular residues for highlighting in the Sting protein structure viewer window and/or recovering textual info about those residues. In order to select a residue, you just have to put the pointer (mouse cursor) over the small rectangle representing that residue and press the left button of you mouse. You can select multiple residues by repeating this process for different residues. If you want to unselect a selected residue, put the cursor on the respective rectangle and press the left button again.
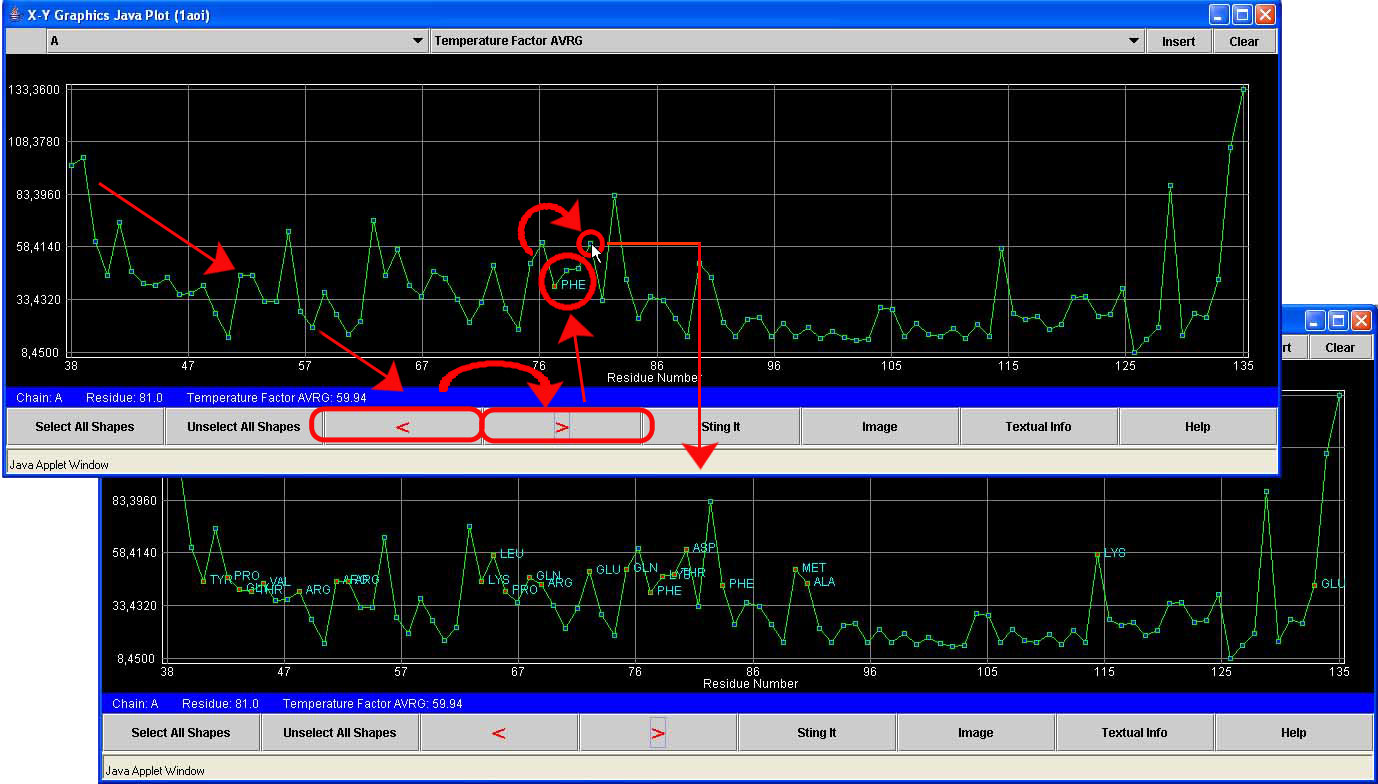
If you want to select all the residues whose value below a given residue r, just press the button "<", in the bottom of the window "X-Y Graphics Java Plot" and select the residue r.
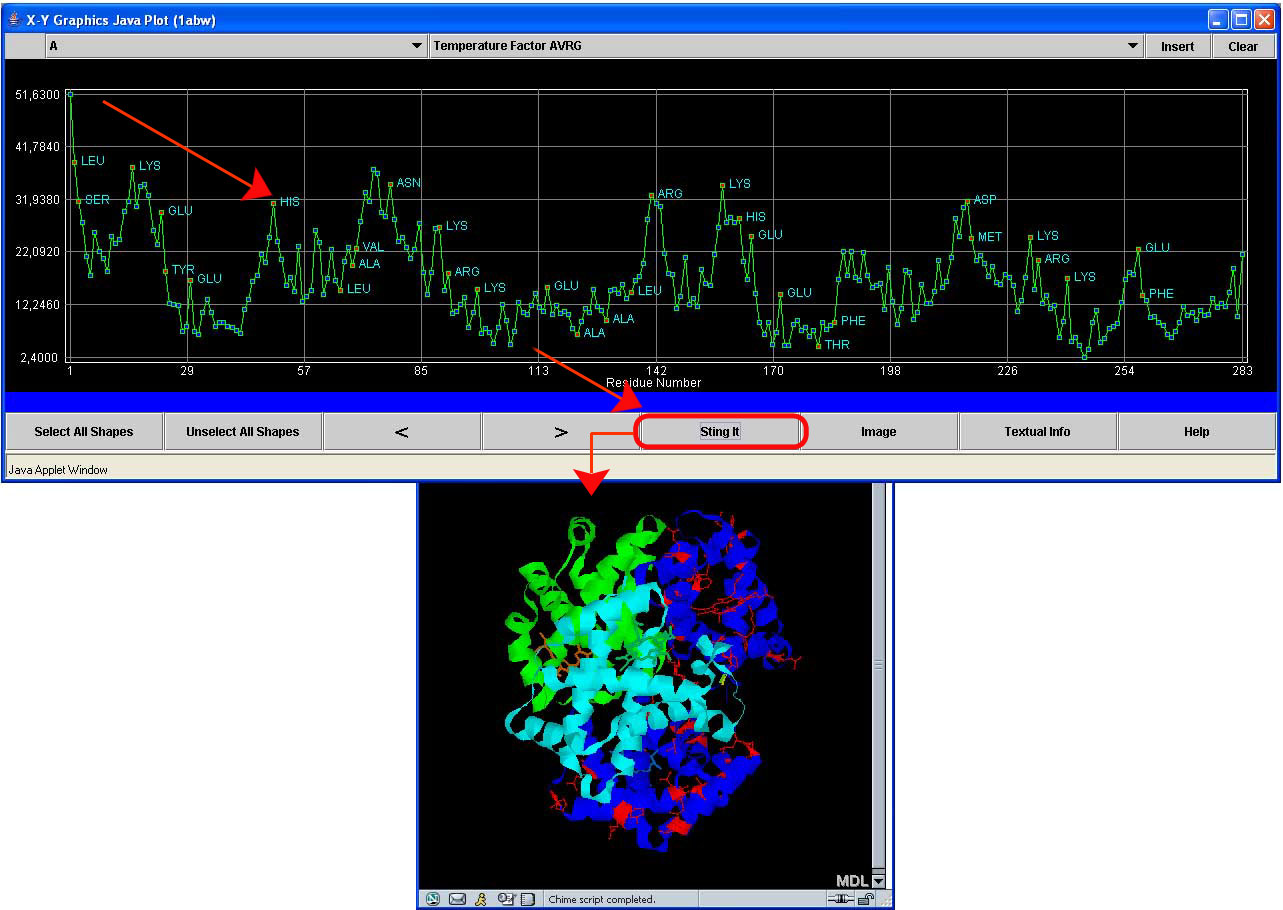
Seeing selected residues on Sting protein structure viewer
Once you have selected a set of residues, you can see those residues highlighted on Sting protein structure viewer by pressing the button "StingIt" in the bottom of the window X-Y Graphics.
For selecting the residues above a given residue r, just press the ">" button and select residue r.
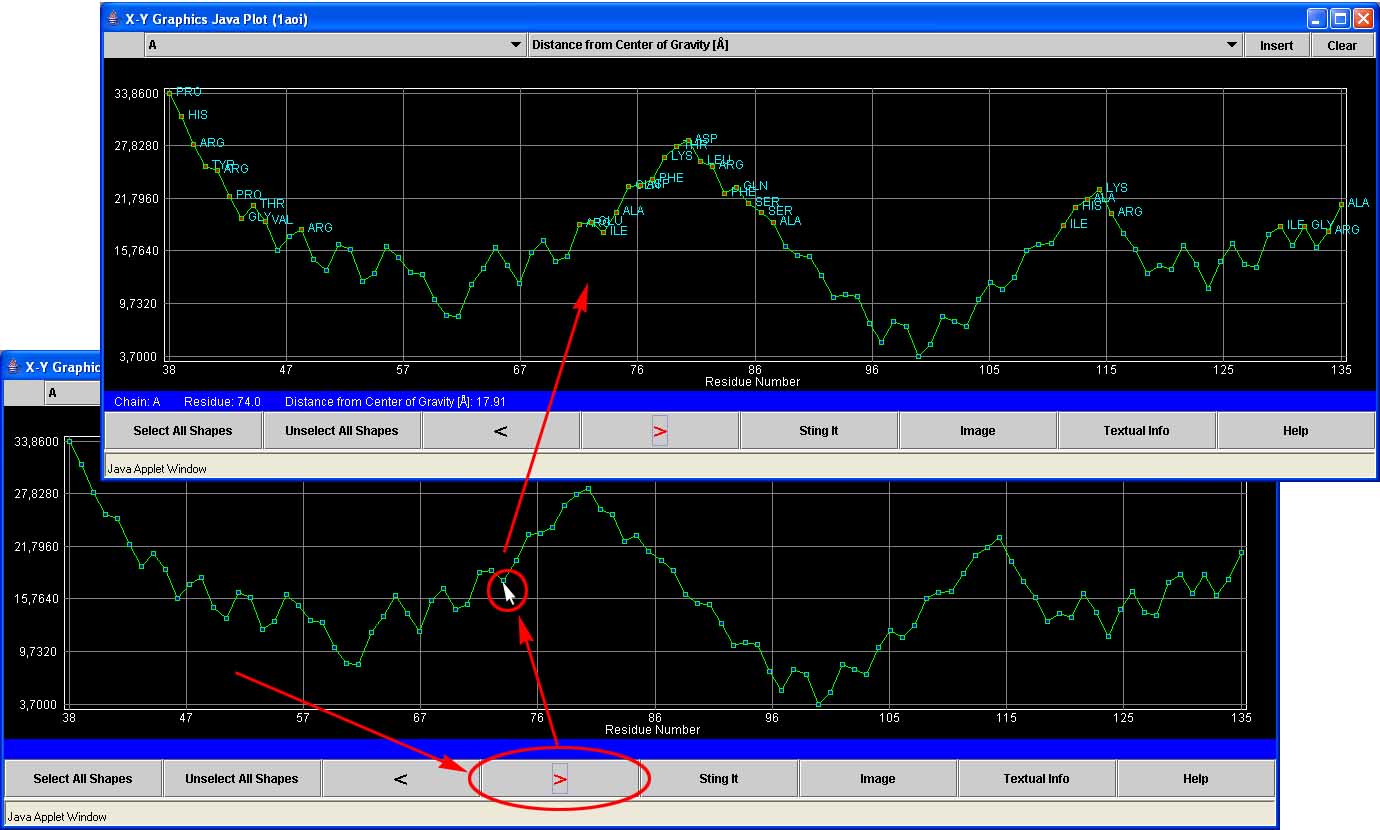
You can press the button "<" and ">" in sequence, and then select two residues in the same colored line, in order to automatically select all the residues in the range between the two selected residues.
Seeing selected residues on Chime (Discontinued)
Once you have selected a set of residues, you can see those residues highlighted on Chime by pressing the button "StingIt" in the botton of the window X-Y Graphics.
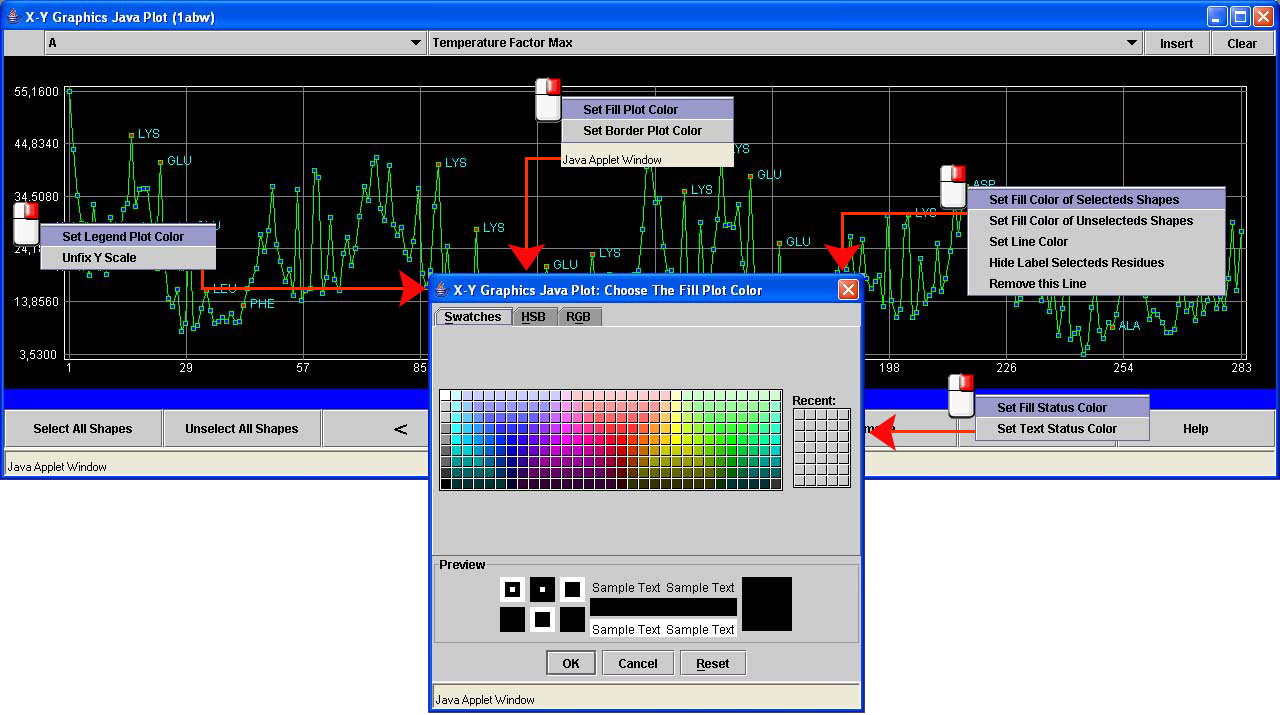
Changing Graphic Colors
You can change the colors of the X-Y Graphic components (background, borders, legends, rectangles representing the residues and the lines representing the variation of the values of a particular parameter among the residues). This facility can be useful for creating images tailored for your particular needs. In order to change the color of a component put the pointer on that componet, press the right button of the mouse and choose set color. For example, to change the color of a line, press the right button of the mouse with the cursor on a residue of that line and then choose Set Line Color.
Generating an Image
First, choose your desired colors for the components of the graphica, as explained above. Then press the button "Image". If you want to save the generated image, put the pointer (mouse cursor) on the figure, press the right button of the mouse and choose "Save Image As...". The program will prompt you to provide the directory where you want to save the image.
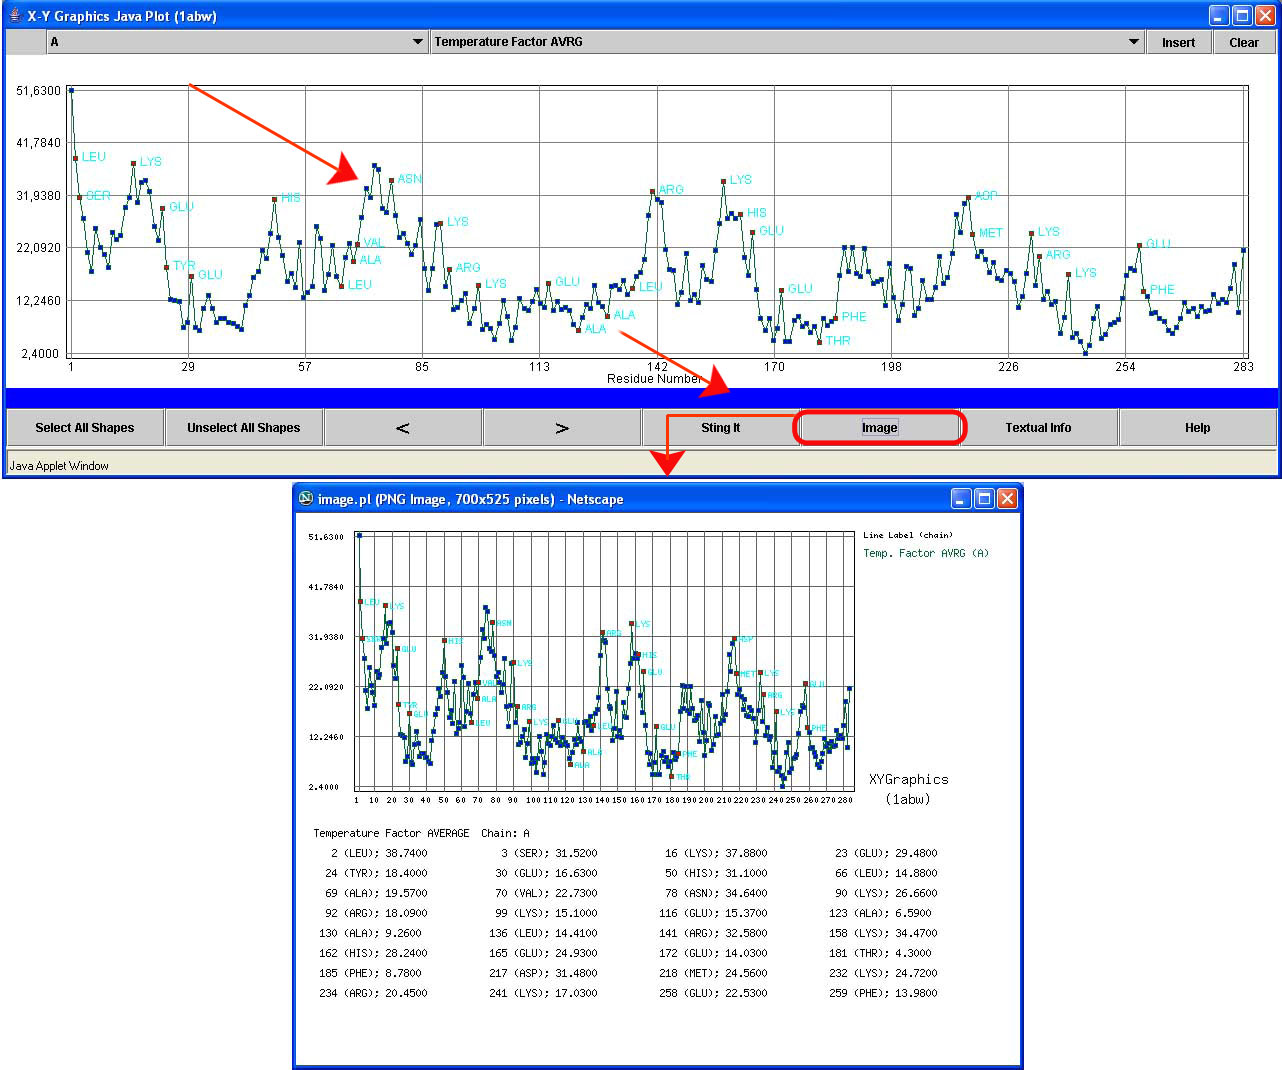
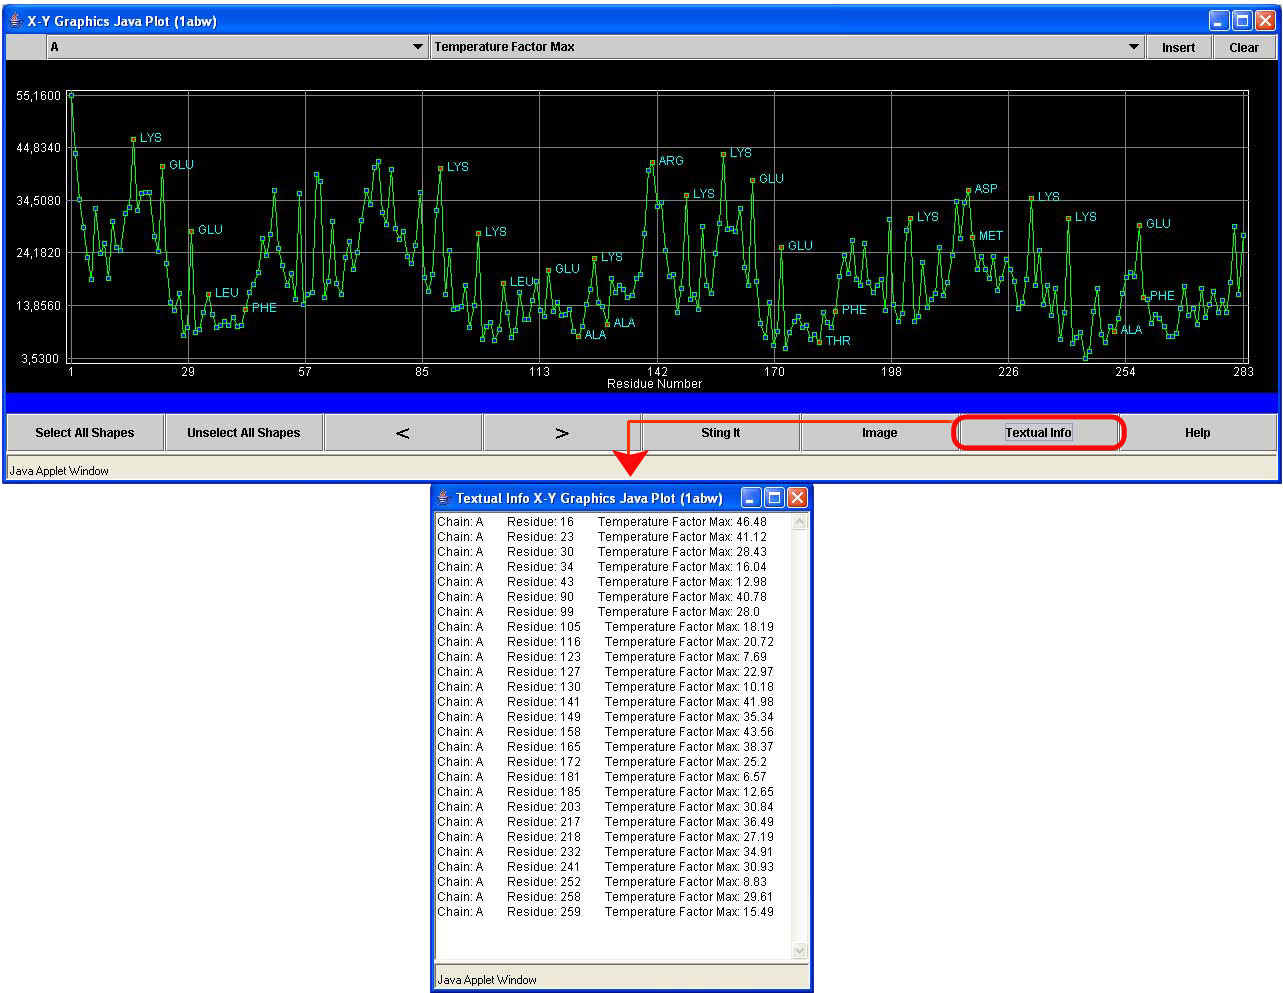
Recovering Parameter(s) Values in Text Format for Selected Residues
Just press the button "Textual Info" and the program will create a window with your data.