Configuring Ranges for Color Scales in JPD
The colors representing the values of physical and chemical parameters in each line of the Java Protein Dossier (JPD) follow the scheme presented in the JPD legend (see option Help | Legend of the JPD main window menu). Each line of he JPD main window represent the values of a particular parameter along the sequence of residues, using a color scale. Each parameter has an associated color scale for representing its values, such as a color scale going from black to white for representing the number of Unused Contacts, and a color scale going from red to blue for representing the value of the Electrostatic Potential.
The effects of changing ranges for color scales
Although the color scale used to represent each parameter is fixed (e.g., gray scale, red to blue, red to green), the values associated with the begining and the end of the color scale for each parameter can be changed. Yhis is done to facilitate the visualization of the variation of the parameter in the residues sequence. These extreme values are defined by the minimum and maximum values of the parameter for different scopes:
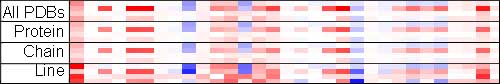
The more restrict the scope used to define the minimum and maximum values for the color scale, the clearer is the distinction between the colors used to represent the values of a parameter in JPD. For example, consider the lines representing the Electrostatic Potential parameters. Setting the scope to all the deposited PDBs can result in subtle distinctions among the colors used in a line, because the minimum and maximum values of a measure for the whole set of deposited PDBs can be far from the values that effectivelly occur in the protein portion presented in a JPD window. Neverthless, restricting the scope to a particular protein or chain, you can reduce the range of values to be represent by the same color scale, and consequently enhance the distiction between the values that effectively occur in a JPD window. In the extreme case, if you choose to restrict the scope to exactly the values that occur in a particular line of the JPD Window, you associate the minimum value of the parameter occuring in the Window with the beginning of the color scale, and the maximum value with the end of the color scale. The following figure shows how you can enhance the distinction between the values of Electrostatic Potential by reducing the scope associated with the color scale used to represent this parameter.
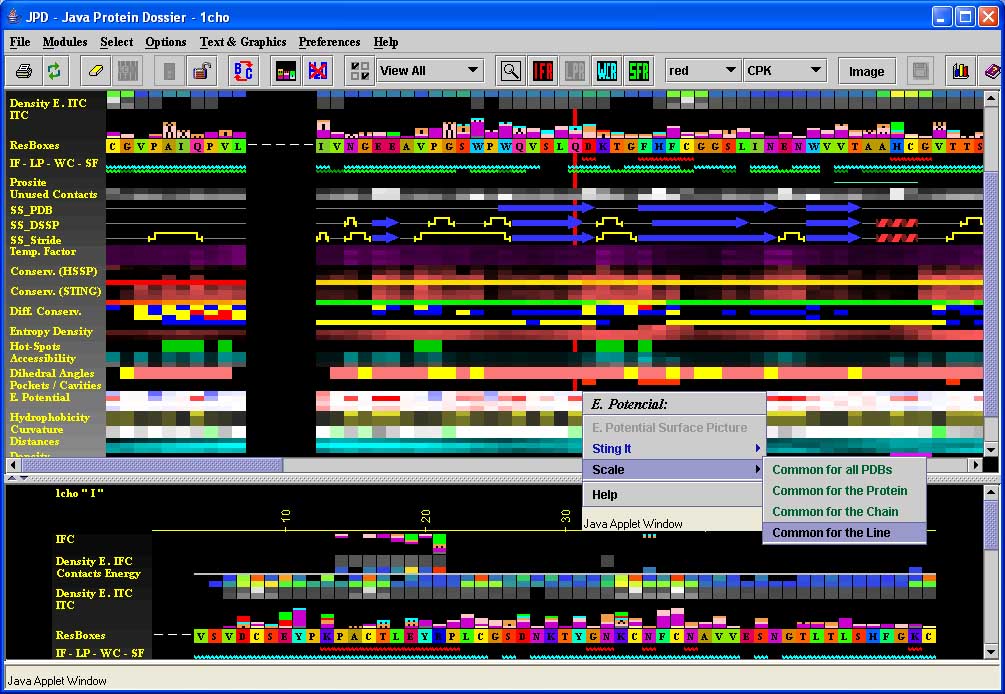
Configuring ranges of color scales for specific lines
In order to set the range of values associated with the color scale of a particular line (parameter) in JPD, you have to click on the repective line with the right button of the mouse and choose one of the option for scale, as illustrated in the figure below. Note that the option to change scale is not available for every line.
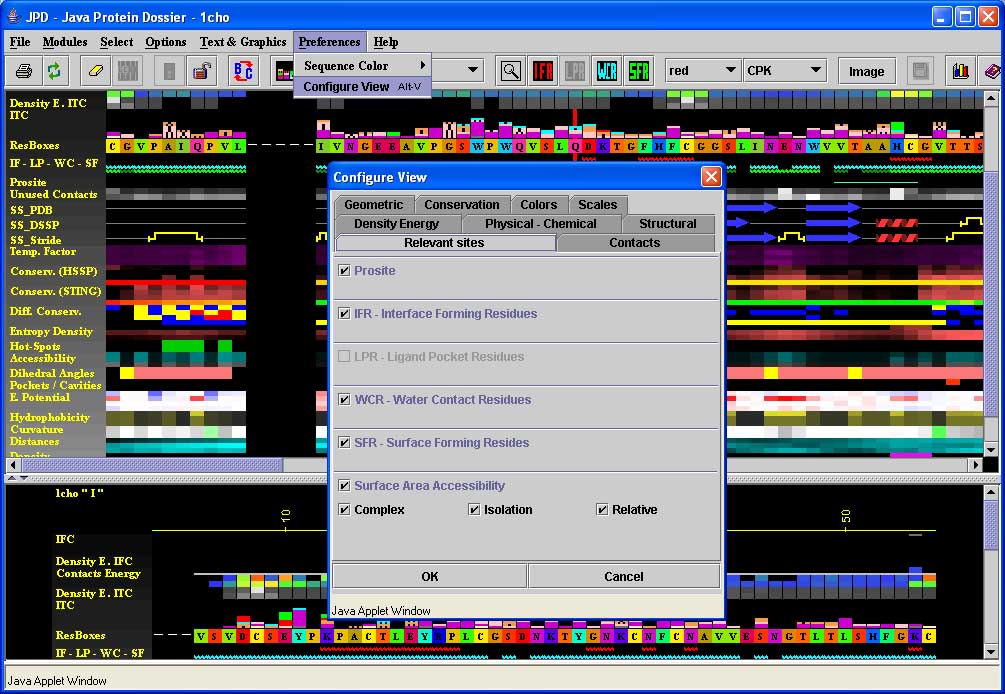
Configuring ranges of color scales for all lines
If you want to change the scope of the ranges associated with all the lines
that allow such a configuration, select the desired scope in the tab Scales
of the option Preferences | Configure View of the top menu of the main
JPD window, as illustrated in the figure below. The default value is set to
a range of colours based on the min and max value in that specific protein chain.